

Understand the difference between profit and cash flow. Learn how to forecast cash, analyze margins, and identify profit leaks in your business.
Back to contractor finance →Why Profit and Cash Flow Are Not the Same Thing
Profit and cash flow are not the same thing.
Profit measures whether you made money after subtracting expenses from revenue. Cash flow measures the actual movement of money in and out of your business.
Suppose you earn revenue on a job in December but do not get paid until February. Under accrual accounting, the earned revenue can appear in December while the cash arrives in February.
Under cash accounting, income is generally recorded when received. Construction contracts can have additional recognition rules, so confirm which basis your reports use. IRS Publication 538 explains the cash and accrual methods.
A profitable report does not guarantee that cash will be available for Friday's payroll. Review both the profit report and the cash forecast before committing to payments or new work.
- ProfitDid recognized revenue cover the recorded costs?
- CashWill available money cover payments when they are due?
- ActionReview both before taking on the next commitment.
How Cash Moves Into and Out of Your Business
When outflows happen before inflows, you need working capital to bridge the gap. This is why a profitable job can drain your bank account.
Consider this simplified, illustrative scenario, not a typical cost structure or a margin target:
- Day 1: You start a $20K job. You buy materials ($8K out of pocket).
- Day 15: You pay your crew ($6K).
- Day 30: You invoice the customer.
- Day 60: The customer pays the $20,000 invoice, assuming payment arrives as planned.
The job has $6,000 left after the $14,000 of listed direct costs, before overhead, taxes, and any other costs. That is gross profit, not take-home cash. Your cash commitment rises from $8,000 on day 1 to $14,000 on day 15 and stays tied up until payment arrives. Three identical jobs with overlapping timing would tie up $42,000 before any deposits or supplier credit.
Actual funding needs depend on the timing of every payment, collection, and other business obligation.
The gap between paying job costs and collecting from the customer creates a funding need. Earlier agreed deposits, timely invoicing, and collection follow-up may shorten that gap without changing the job's margin. The formal cash conversion cycle also considers inventory and supplier-payment timing; the job timeline alone is not a full calculation.
Reading Your Profit and Loss Statement for Business Owners
Your profit and loss statement (or income statement) shows revenue, expenses, and profit for a specific period. Review it regularly enough to spot changes while you can still respond. A monthly review is a practical starting point, with more frequent job and cash checks when work is moving quickly.
The P&L is organized simply:
- Revenue at the top (sales recognized under your accounting method, which may differ from customer payments)
- Cost of Goods Sold (materials, subcontractors, direct labor)
- Gross Profit (revenue minus COGS)
- Operating Expenses (the overhead needed to run the business)
- Operating Profit (gross profit minus operating expenses)
- Net Profit (after other income and expenses included in your accounts)
The P&L does not explain every movement of cash. A loan can add cash without creating revenue; repaying loan principal or taking an owner draw can reduce cash without becoming an operating expense. Equipment purchases and depreciation can also affect cash and profit in different periods.
These differences are why your P&L can show profit while available cash is tight. The SEC's guide to financial statements distinguishes the income statement from the cash flow statement, which reports cash from operating, investing, and financing activities.
To use your P&L effectively, compare it to your cash position.
Use the P&L alongside your balance sheet, unpaid customer invoices, and upcoming bills. A monthly review is more useful when the books are reconciled and missing costs have been resolved.
Profit Margin Analysis for Small Businesses
Your profit margin tells you what percentage of each revenue dollar you keep as profit. Margin is a ratio, not a dollar amount, and a healthy margin on a job you can't collect is not health at all.
The three margins that matter
- Gross margin = (Revenue minus Cost of Goods Sold) ÷ Revenue × 100%. This measures the profitability of the work itself, before overhead.
- Operating margin = Operating profit ÷ Revenue × 100%, where operating profit is gross profit minus operating expenses such as rent, insurance, admin, and marketing. This shows operating profitability after the cost of running the business.
- Net margin = Net profit ÷ Revenue × 100%, after the other income and expenses recorded in the business accounts. Entity-level income taxes may be included; an owner's personal income taxes usually are not business expenses. Net profit is not necessarily available to withdraw.
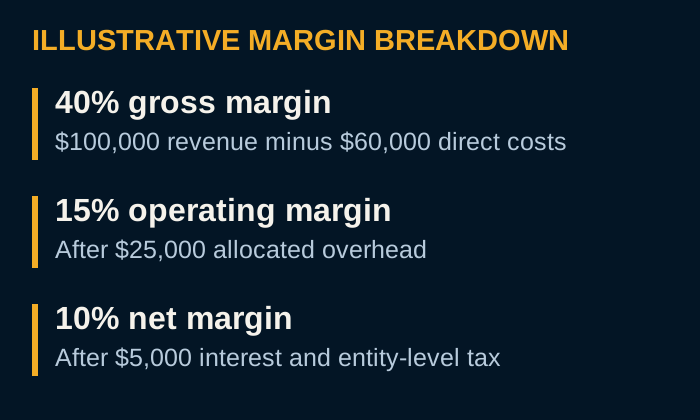
Illustrative worked example, not an industry benchmark: a $100,000 job with $60,000 in materials, direct labor, and subcontractors has a 40% gross margin. With $25,000 of allocated overhead, operating profit is $15,000 (15% operating margin). If interest and any applicable entity-level taxes take another $5,000, net profit is $10,000 (10% net margin). When someone quotes a margin, ask: margin at which level?
Margin is a timing story, not just a percentage
A job with a 40% gross margin collected in June places a different demand on cash than an otherwise identical job collected in April. The margin percentage may be unchanged, but the funding gap is longer.
Pair margin analysis with days sales outstanding (DSO), an estimate of how long sales on credit remain uncollected.
A period-end version is (Accounts Receivable ÷ Credit Sales for the Period) × Days in the Period. Some methods use average receivables instead. Oracle's DSO documentation illustrates a different monthly measure: the average days open for invoices fully paid during that month.
Keep the method and period consistent, exclude cash sales from credit sales, and do not calculate the ratio when credit sales are zero. DSO is an indicator, not a promise of when a particular invoice will be paid.
This is why margin analysis and cash-flow analysis belong in the same conversation: a strong-looking margin can be a cash trap if the collection cycle is long.
Margin by job type, not just by company
Company-wide margin hides the truth. Break it down by job type, customer, or service line and patterns emerge fast. The busiest service line may be less profitable than it looks once the direct costs are assigned correctly. Comparing service lines helps you test that possibility rather than guess.
Use job-level costing: direct materials, direct labor hours at a fully loaded rate (wages plus payroll taxes plus benefits), subcontractor invoices, and job-specific permits or equipment.
The margin diagnostic a coach runs
- Pull three months of P&L and the job cost detail behind it. Confirm job-level margins roll up to company gross margin; if not, investigate timing, unassigned costs, and differences in cost classification before relying on the comparison.
- Rank job types by gross margin and revenue. High revenue with low margin is the classic profit leak.
- Pair each job type with its DSO. For a job type with a few large invoices, also look at actual invoice ages and payment terms. A high-margin, slow-collecting job can still create a funding problem.
- Check the trend, not the snapshot. A shrinking gross margin while revenue grows can point to rising costs, weak pricing, a different job mix, or incomplete records. Find the cause before changing prices.
- Agree on one action. Raise price on the low-margin line, tighten scope, renegotiate a supplier term, or stop pursuing the work. One action, one owner, one date.
A shrinking gross margin paired with rising revenue deserves investigation. It can put pressure on cash, particularly when extra work requires spending before collection. It does not, by itself, prove that a cash crisis is coming.
Margin tells you whether the work is worth doing. DSO tells you when you actually get paid for it. Track them together, by job type, and you have a diagnostic that points to a specific action rather than a general worry.
How to Improve Business Profit Margins
Improving margins doesn't always mean charging more. It means being intentional about where profit leaks happen.
Tighten your labor tracking. Assign hours and the agreed fully loaded labor rate to the right jobs. Compare actual labor with the estimate while work is still underway. Avoid charging payroll costs twice when allocating them to jobs.
Control scope creep. Document added work, obtain the required approval, and include approved charges in your progress-billing process. An unbilled change order can consume labor and materials without adding revenue.
Standardize your processes. Use repeatable purchasing, receipt submission, and job-code routines to reduce avoidable rework. Follow a consistent material-cost tracking process so returns, waste, and transfers do not distort the reports.
Better job costing and labor tracking can reveal where to act. Check profit leaks, review supplier terms, and test whether the proposed change improves margin without creating a larger cash commitment. The right first action depends on the cause, not a universal rule.
Creating a Cash Flow Forecast Template for Your Operations
A cash flow forecast estimates when money will come in and go out. A rolling 13-week view is a useful short-term planning format, with a longer monthly forecast alongside it if seasonality or major purchases matter. A budget sets the plan; a forecast updates expected outcomes using current information. Both can include profit and cash, but this template focuses on payment timing.
An outdated forecast can miss new bills and collection delays. Keep the view rolling: keep a 13-week horizon, and each week drop the week that ended and add a new week 13.
The columns your template actually needs
A two-column in/out sheet hides the problem. Build these columns instead:
- Week beginning (Monday date)
- Opening cash (last week's closing balance)
- Collections, expected (place each payment in its likely collection week; approval is not a guarantee)
- Other Cash Inflows (loan proceeds or owner contributions, shown separately from customer receipts)
- Payroll and Job Costs (payroll, subcontractors, materials, and supplier payments by due week)
- Overhead and Other Payments (rent, insurance, software, equipment, taxes, loan principal, and planned owner draws, each counted once)
- Closing Cash (opening cash plus all inflows minus all payments)
- Minimum Cash Buffer (the cash floor you have chosen for this business)
- Surplus or Shortfall (closing cash minus the buffer)
That last row drives action. A closing balance tells you what happened; surplus or shortfall against a floor tells you what to do this week.
Set a minimum cash buffer before you forecast
Pick a cash floor that reflects your payroll dates, supplier commitments, tax obligations, collection uncertainty, and access to funding. There is no single buffer that fits every business. Separate restricted cash from money available for ordinary payments.
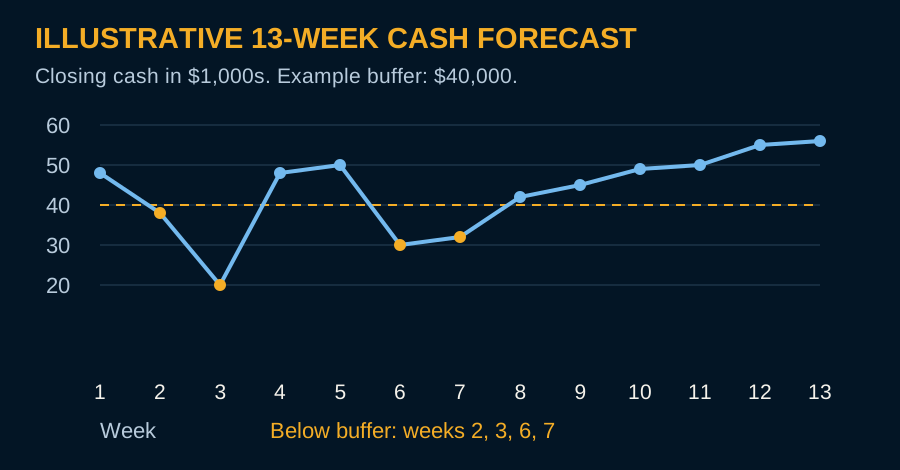
For the illustration below, assume the owner chooses a $40,000 floor; that is an example, not a recommended minimum. A week below your chosen floor calls for a decision while there is still time to act.
A worked 13-week example
This is an illustrative forecast with invented, fully stated cash assumptions, not a client case study or a suggested spending pattern.
- Starting available cash is $60,000 and the chosen buffer is $40,000.
- Two outstanding invoices, $18,000 and $30,000, are expected in weeks 2 and 4 based on their ages and anticipated payment dates.
- Later receipts represent other customer payments assumed for the example.
- Payments include all scheduled payroll, supplier costs, overhead, and other obligations; week 6 includes a hypothetical $12,000 tax payment.
- No borrowing, owner contributions, or restricted cash are included.
Illustrative cash forecast. On smaller screens, scroll across to see every column.
| Week | Opening Cash | Cash In | Payments | Closing Cash | Above / Below $40,000 Buffer |
|---|---|---|---|---|---|
| 1 | $60,000 | $0 | $12,000 | $48,000 | +$8,000 |
| 2 | $48,000 | $18,000 | $28,000 | $38,000 | -$2,000 |
| 3 | $38,000 | $0 | $18,000 | $20,000 | -$20,000 |
| 4 | $20,000 | $30,000 | $2,000 | $48,000 | +$8,000 |
| 5 | $48,000 | $12,000 | $10,000 | $50,000 | +$10,000 |
| 6 | $50,000 | $0 | $20,000 | $30,000 | -$10,000 |
| 7 | $30,000 | $14,000 | $12,000 | $32,000 | -$8,000 |
| 8 | $32,000 | $20,000 | $10,000 | $42,000 | +$2,000 |
| 9 | $42,000 | $18,000 | $15,000 | $45,000 | +$5,000 |
| 10 | $45,000 | $16,000 | $12,000 | $49,000 | +$9,000 |
| 11 | $49,000 | $15,000 | $14,000 | $50,000 | +$10,000 |
| 12 | $50,000 | $20,000 | $15,000 | $55,000 | +$15,000 |
| 13 | $55,000 | $15,000 | $14,000 | $56,000 | +$16,000 |
The forecast drops below the chosen floor in weeks 2, 3, 6, and 7. The lowest closing balance is $20,000 in week 3. Starting cash of $60,000 looked comfortable, but the schedule identifies specific weeks that need attention.
Before deciding how to cover the gap, confirm receipt dates, check invoice disputes, and review which payments are contractual or statutory obligations. Discuss changes to supplier terms rather than assuming you can delay payment. A collection that slips can make more than one later week worse, so update the whole model. For job-based cash timing, use the construction cash-flow forecast guide alongside this example.
Build three scenarios, not one
A single forecast is a guess. Three scenarios turn it into a plan.
- Base case: use reasonable collection dates based on actual customer behavior and planned job starts. Separate committed work from uncertain new work.
- Downside case: test delayed payments from important customers, a later job start, or less new work than expected. Choose delays that fit your actual exposure. This can show when to discuss financing or other options before a shortfall develops.
- Upside case: test an additional job or an earlier collection, including the extra spending that comes with the work. Use it to assess potential headroom, not as permission to commit uncertain cash to debt, equipment, or hiring.
Run all three in the same spreadsheet, three columns per week or three tabs. Act on the downside case first: if it shows a shortfall in week 5, start the lender conversation in week 1, not week 5.
The weekly and monthly cadence
- Weekly: update actual collections and payments from the past week, drop week 1, add a new final week, and check whether any week now closes below the buffer.
- Monthly: confirm actual cash against reconciled bank balances, refresh the downside case with current customer payment behavior, and confirm tax deposit dates for the next 90 days.
- Quarterly: rebuild the base case from scratch using the last quarter's actuals, and reset the buffer if fixed costs have changed.
A rolling 13-week forecast with a written cash buffer and three scenarios converts cash flow from a monthly surprise into a weekly decision. The forecast is not a report, it is the agenda for your coaching session.
A spreadsheet may be enough when the inputs are manageable and someone updates it consistently. With multiple entities, complex jobs, or less time to maintain the model, consider suitable forecasting software or a fractional CFO. Compare the support required with its full cost.
Include taxes in the forecast on the dates they are due. IRS estimated-tax guidance explains that payment requirements depend on the taxpayer and business structure. Confirm the amounts and dates with your tax adviser rather than treating the example payment as a rule.
Diagnosing Your Financial Health: A Coaching Workflow
Use this as a suggested review process, adapting it to your business and the quality of the records available.
- Confirm the starting numbers. Reconcile bank and card accounts, check missing invoices and bills, and confirm the accounting basis. If reports are unreliable, start with bookkeeping cleanup before interpreting the trends.
- Analyze your working capital. Working capital is current assets minus current liabilities, not just receivables minus payables. Review customer invoice ages, retainage, inventory, unpaid bills, and near-term debts. Then compare collection dates with payment due dates, because a positive balance does not mean cash is available this Friday.
- Connect margins to the jobs. Compare estimated and actual direct costs, check unassigned labor and materials, and review gross margin by job type. Look for an explanation before calling a change a pricing problem.
- Update the cash forecast. Enter the expected collections and required payments, test a realistic downside scenario, and identify any week below the chosen buffer. Keep financing separate from operating receipts so borrowed cash does not look like stronger trading performance.
- Choose one action and follow through. Assign a person and a date to a specific step, such as resolving an invoice dispute, billing approved extra work, or reviewing a low-margin estimate. At the next review, check what changed in both the report and the cash schedule.
At Golden Bookkeeping, construction bookkeeping helps keep the records useful, while fractional CFO guidance can help business owners connect financial reports to practical decisions. A complimentary Profit Review is a starting point for discussing where the books, job margins, or cash timing need attention.
Put Profit and Cash Flow to Work
Understanding profit and cash flow is the foundation of financial control. Profit shows whether the work is earning enough after the costs recorded in your accounts. Cash planning shows whether money is expected to be available when obligations are due.
Track net profit, available cash, and collection timing regularly, and review the cash forecast weekly when payment timing is tight. Use profitability tracking to keep job performance visible between reviews. A trend should lead to a question and a practical action, not just another report in a folder.
Golden Bookkeeping specializes in helping contractors and building trade businesses see their financial picture clearly. Bring the job-cost questions, unpaid invoices, and upcoming commitments to a Profit Review so the next step is based on your business, not a generic target.
Frequently asked questions
What is the difference between profit and cash flow?
Profit is the money left after subtracting expenses from revenue on your profit and loss statement. Cash flow tracks actual money moving in and out of your bank account. You can be profitable on paper but have no cash available if customers owe you money or you've invested in inventory. Under accrual accounting, a contractor may recognize earned job revenue before receiving payment; the whole invoice is revenue, not profit. Under cash accounting, income is generally recorded when received. Both matter: profit shows business performance, cash flow shows survival.
How can I identify profit leaks in my business?
Start by comparing job costs to job revenue. Track labor hours, material waste, and equipment time per project. Review your profit and loss statement monthly to spot expense categories growing faster than revenue. Common leaks: unbilled labor, material overages, discounted pricing that erodes margins, and overhead that the pricing does not cover. A profit margin analysis reveals which jobs or service lines are underperforming. Possible actions include reviewing pricing, reducing avoidable waste, or reconsidering low-margin work, depending on what the records show.
How do I create a cash flow forecast for my business?
Start with available opening cash and list expected customer receipts, other inflows, and payments by week for the next 13 weeks. Calculate closing cash as opening cash plus inflows minus payments, then compare it with your chosen minimum buffer. Place cash receipts in the expected payment week regardless of when revenue appears in the P&L. Update weekly, test delayed collections, and add a longer monthly view for seasonality or major commitments. The forecast helps you identify potential shortfalls early; it cannot guarantee payment dates or prevent every cash problem.
Why should a small business owner work with a financial coach?
A financial coach translates raw numbers into actionable decisions. They help you understand which jobs are truly profitable, why cash is tight despite good sales, and where to cut costs or raise prices. For contractors and trades, specialized coaches understand job costing, material timing, and seasonal cash swings. They can help you interpret reports and reduce the uncertainty of guessing whether your business is healthy. A coach also holds you accountable to financial goals and helps you build systems so you're not firefighting month to month.
Related insights

